Plotting graphs and creating image galleries
There are many R modules that can be very useful for plotting your data, especially in bioinformatics. A common necessity, is that you make your R scripts reproducible and publish your graphs in some standard way.
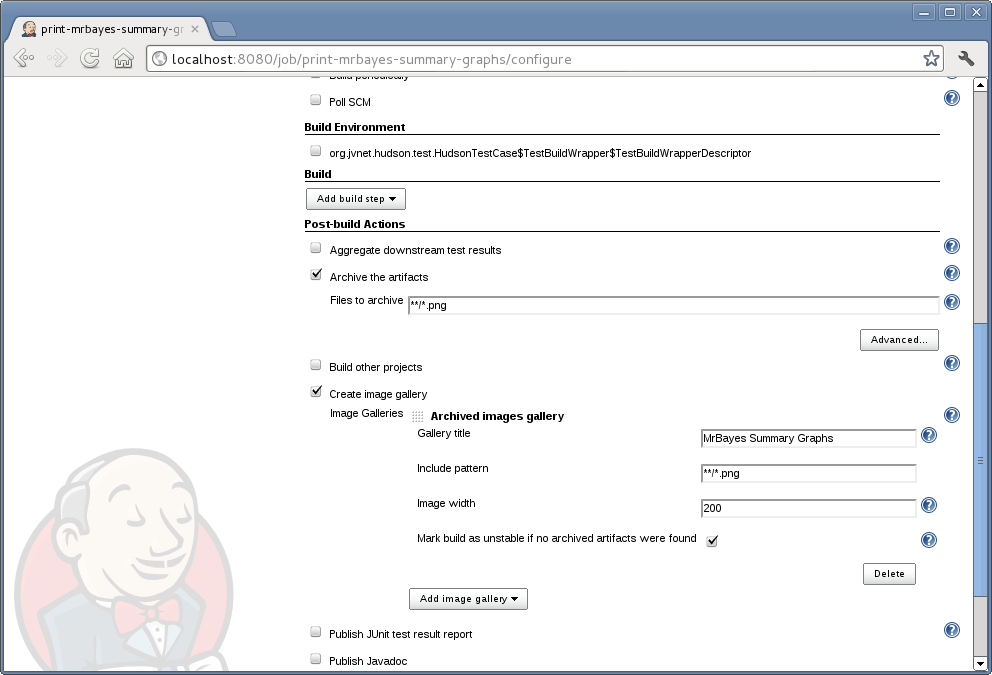
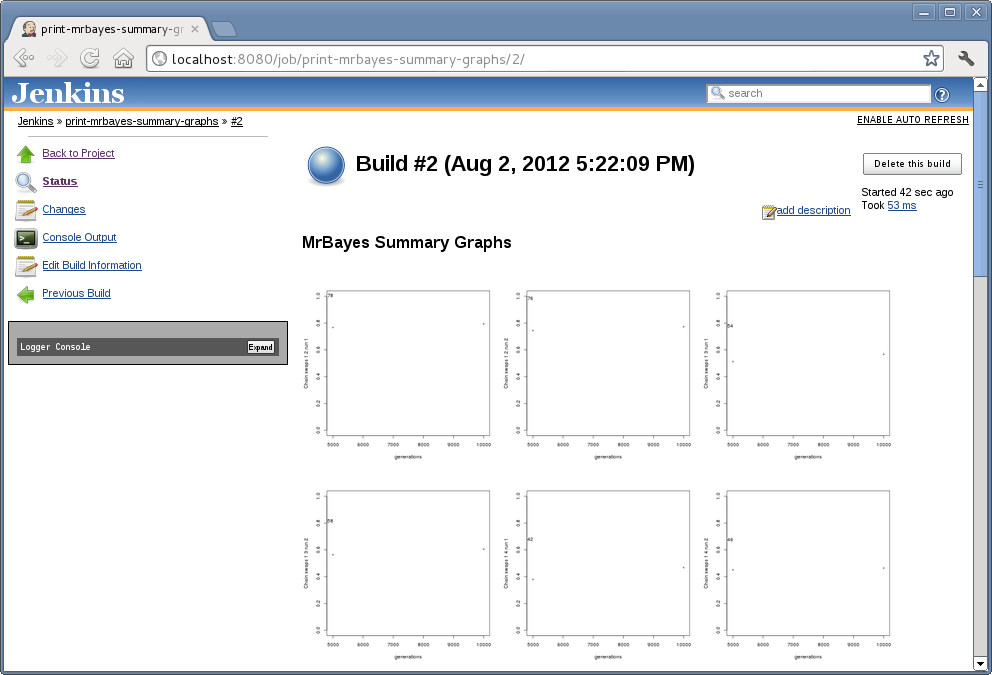
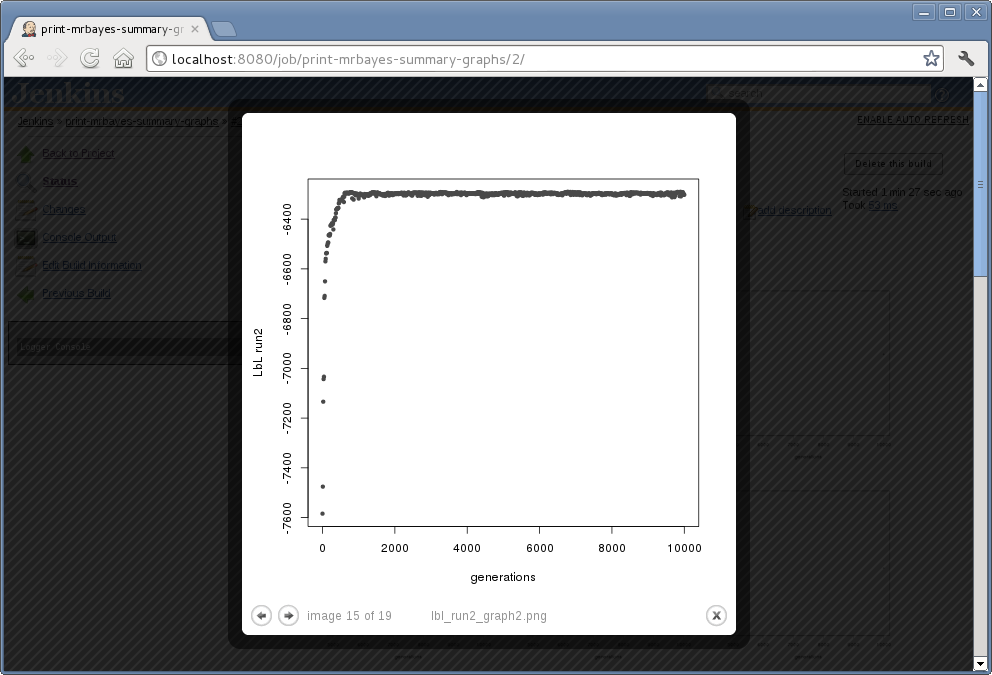
With this thought in mind, we proposed an R plug-in + Image Gallery Plug-in pipeline. With the former you can create an interface for R scripts and, using the latter, you can create image galleries in Jenkins for displaying your graphs to other users.
You can create many different types of galleries. Some of these galleries may use patterns to look for images in your job workspace.
The image galleries give you a simpler interface for showing your graphs to other users, as well as for yourself to analyze the results of your analysis.
The work on BioUno resulted in Jenkins Image Gallery plug-in, released to the whole Jenkins community.